
The plan was 8km. Easy, controlled, purely aerobic. Let yesterday’s 18km settle.
I came back with 12.43.
Not because I pushed. Because the body was there, and the numbers were showing it.
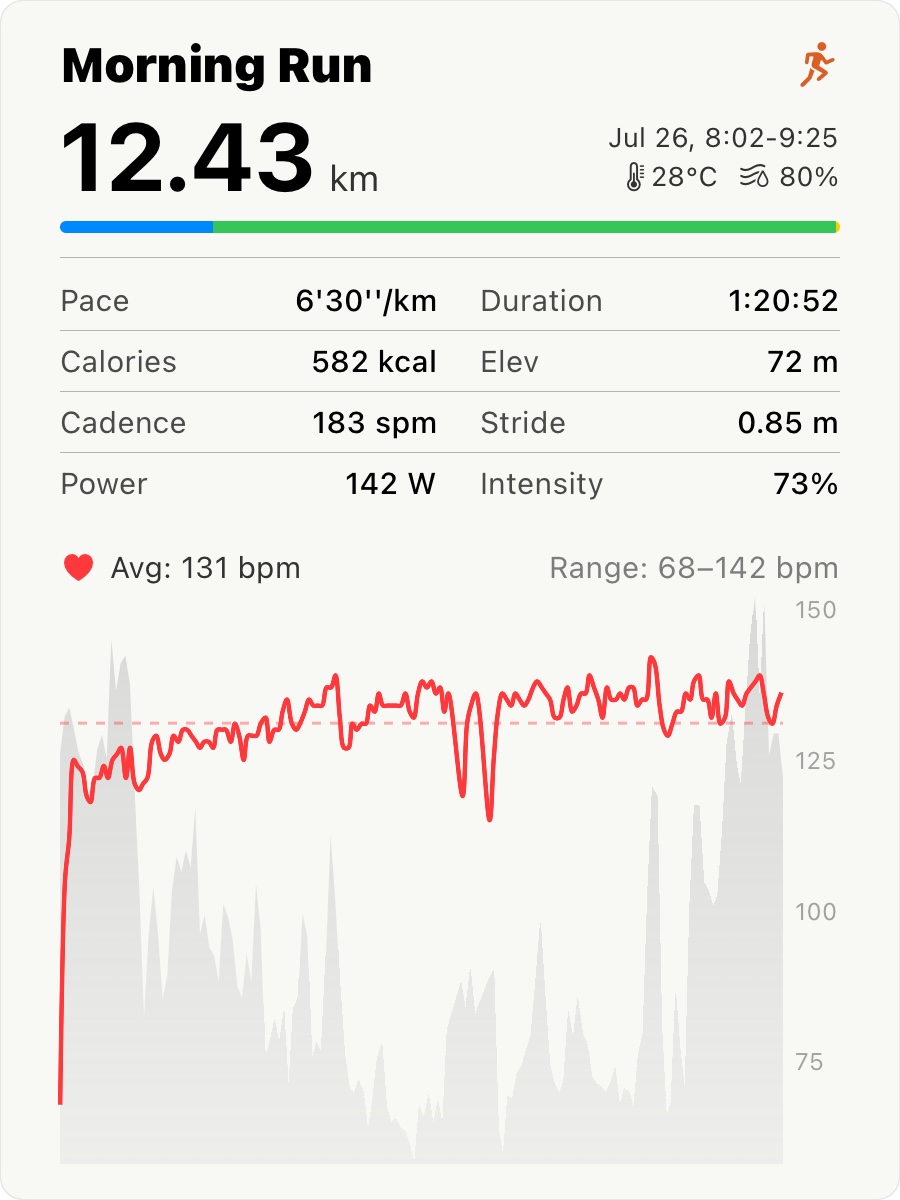
What the curve looked like today#
Compare yesterday’s HR chart with today’s and the difference is immediate.
Yesterday: a continuous upward drift from the first kilometre, the line climbing steadily through the session before pressing into the 150s in the final stretch. The signature of a humid LSD — cardiac drift doing exactly what it does.
Today: flat. The line holds in the low 130s from the warm-up through to the end, hovering just above the dashed average. The one sharp dip around the 5km mark is the hill — heart rate dropping briefly during the descent, then recovering and returning to the same controlled band. No sustained climb. No drift.
Average 131 bpm in 28°C and 80% humidity is genuinely Zone 2 for me (ceiling: 139). The zone distribution bar confirms it — almost entirely blue and green. Yesterday’s session was managed drift; today’s session was actual aerobic recovery.
The two days read differently because they were different. The data makes that visible.
Efficiency Factor: 1.10 → 1.18#
This is the number I kept coming back to after the run.
Efficiency Factor (EF) is the ratio of pace output to cardiovascular cost — roughly, how much speed you’re getting per unit of heart rate effort. A higher number means your body is doing more with the same cardiac load.
Yesterday’s LSD: 1.10.
Today’s recovery run: 1.18.
The jump matters for two reasons. First, it confirms what I felt — the legs were lighter today, the effort was lower, the system had absorbed yesterday’s work. Second, it’s a useful one-day comparison because the conditions weren’t easier: 28°C and 80% humidity is still hot. The EF improvement wasn’t given by the weather. The body earned it.
This is the kind of cross-session comparison that only makes sense if you can see both sessions side by side, in context. A single EF reading means very little. Two readings, 24 hours apart, after a hard session and then a recovery session — that tells you something real.
Why I ran more than planned#
At 8km I felt fine. Not the careful, managing-myself kind of fine — genuinely fine. The heart rate was sitting where I wanted it, the pace felt easy, the heat wasn’t accumulating into fatigue the way it had yesterday.
So I kept going. Not to hit a distance target. Because the body was signalling that it had more to give, and the data was agreeing.
That’s what a good recovery run is supposed to feel like. Not a chore you survive. A session where you rediscover what your legs can do when you’re not asking them to prove anything.
Twelve kilometres. Zero tired. One good number.
Yesterday: 18km LSD in 83% humidity — cardiac drift, HRV at baseline lower limit, a session of managed effort.