
If you have a favorite benchmark running route—a 10k or 14k loop near your house—you have probably experienced this classic puzzle:
“I ran the exact same loop on July 20th and July 29th. I took the exact same sidewalks, made the exact same turns, and stopped at the exact same crosswalks. Yet my watch logged 13.98 km on the 20th and 13.86 km on the 29th—a 120-meter difference. Which day was the true distance?”
Most runners assume that on one of those days, their watch simply “lost satellite signal” or experienced “bad GPS drift.”
Earlier this week, a runner friend brought me two raw .FIT activity files (exported from Apex Run) after experiencing this exact 120-meter puzzle on his 14km benchmark route. To help him solve the mystery, I built a browser-based tool to dissect both files side-by-side: the GPX & FIT Track Comparator.
When we laid both .FIT files on top of each other and peeled back their raw binary layers, we didn’t just find a simple satellite glitch. We uncovered two far more eye-opening technical revelations:
- The Day-to-Day 120m Discrepancy: The 120-meter gap between the two runs was caused by 71 meters of actual satellite track drift plus 49 meters of day-to-day variance in watch sensor fusion algorithms.
- The 300-Meter Device Inflation: On both days, the distance displayed on the watch screen was 260 to 310 meters LONGER than the geometric 2D line drawn by its own GPS points.
Here is the technical deep-dive into why this happens, how smartwatch distance algorithms actually work under the hood, and what it means for sports data processing.
1. The Empirical Experiment: Comparing The Two Raw FIT Files#
To investigate the root cause, we ingested both .FIT files into a binary parser. We extracted two distinct layers of distance metrics from each file:
- Device Session Recorded Distance (
data.sessions[0].total_distance): The total mileage calculated and stored by the watch hardware firmware (displayed on screen). - Raw GPS Haversine Sum: The mathematical sum of 2D Haversine distances calculated sequentially across every latitude/longitude coordinate point in the record array.
The Side-by-Side Data Comparison#
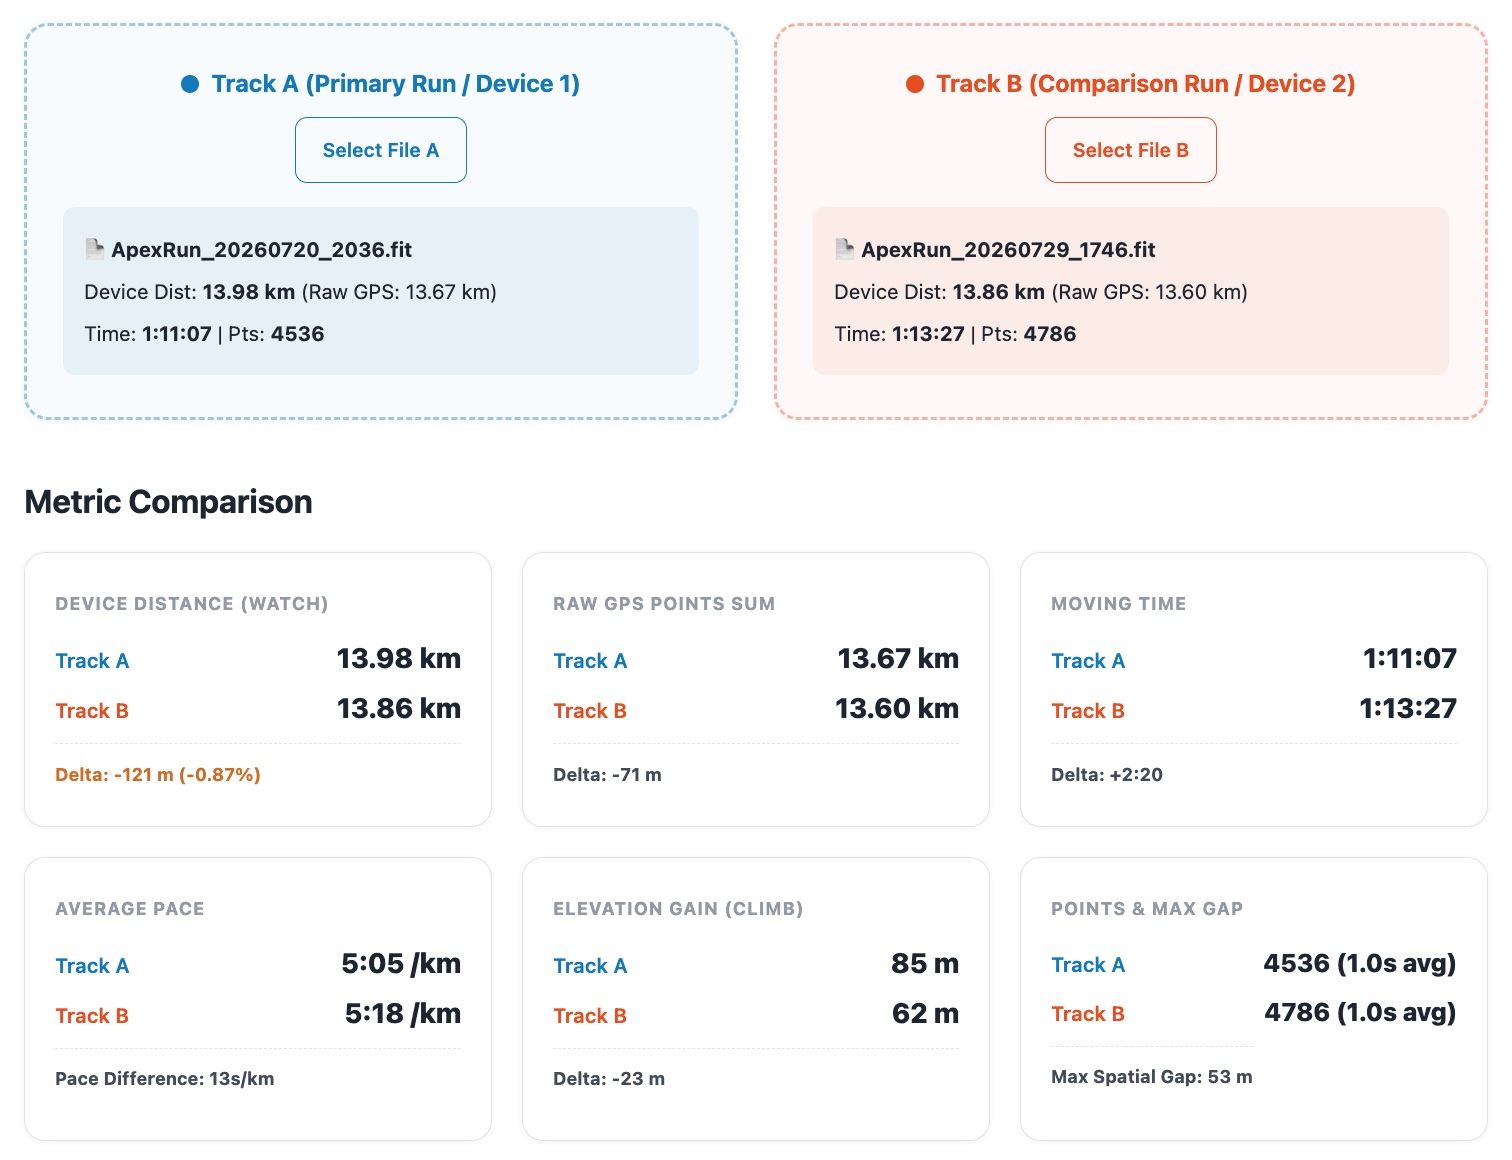
Here is the exact data extracted from both files:
Run 1 (July 20th - Track A):
- Watch Firmware Distance: 13.98 km (13,980 m)
- Raw GPS Points Sum (Haversine 2D): 13.67 km (13,673 m)
- Firmware Algorithm Addition: +307 meters (+2.2%)
Run 2 (July 29th - Track B):
- Watch Firmware Distance: 13.86 km (13,860 m)
- Raw GPS Points Sum (Haversine 2D): 13.60 km (13,602 m)
- Firmware Algorithm Addition: +258 meters (+1.9%)
Discrepancy (July 20 vs July 29):
- Watch Firmware Delta: 120 meters (13.98 km vs 13.86 km)
- Raw GPS Coordinates Delta: 71 meters (13.67 km vs 13.60 km)
- Sensor Fusion Variance: 49 meters (307 m vs 258 m)
The Two Revelations That Surprised Us#
Look closely at the numbers above:
- Revelation 1: The 71m GPS Satellite Drift: When summing pure satellite coordinates (2D Haversine geometry), the two runs across different days differed by 71 meters over 14 kilometers.
- Revelation 2: The Massive +300m Device Addition: On both days, the final distance recorded by the watch firmware (13.98 km / 13.86 km) was 258 to 307 meters LONGER than the raw 2D GPS points sum (13.67 km / 13.60 km)!
This raises a fundamental question: Why is a smartwatch’s recorded distance 300 meters longer than the geometric line drawn by its own GPS points?
The Kilometer Breakdown: Steady Accumulation vs. Sudden Gaps#
To evaluate whether the 71-meter satellite coordinate gap occurred suddenly (e.g. a momentary signal drop or missing finish line segment), we evaluated Track B (July 29) against Track A’s (July 20) 1.0 km progress milestones:
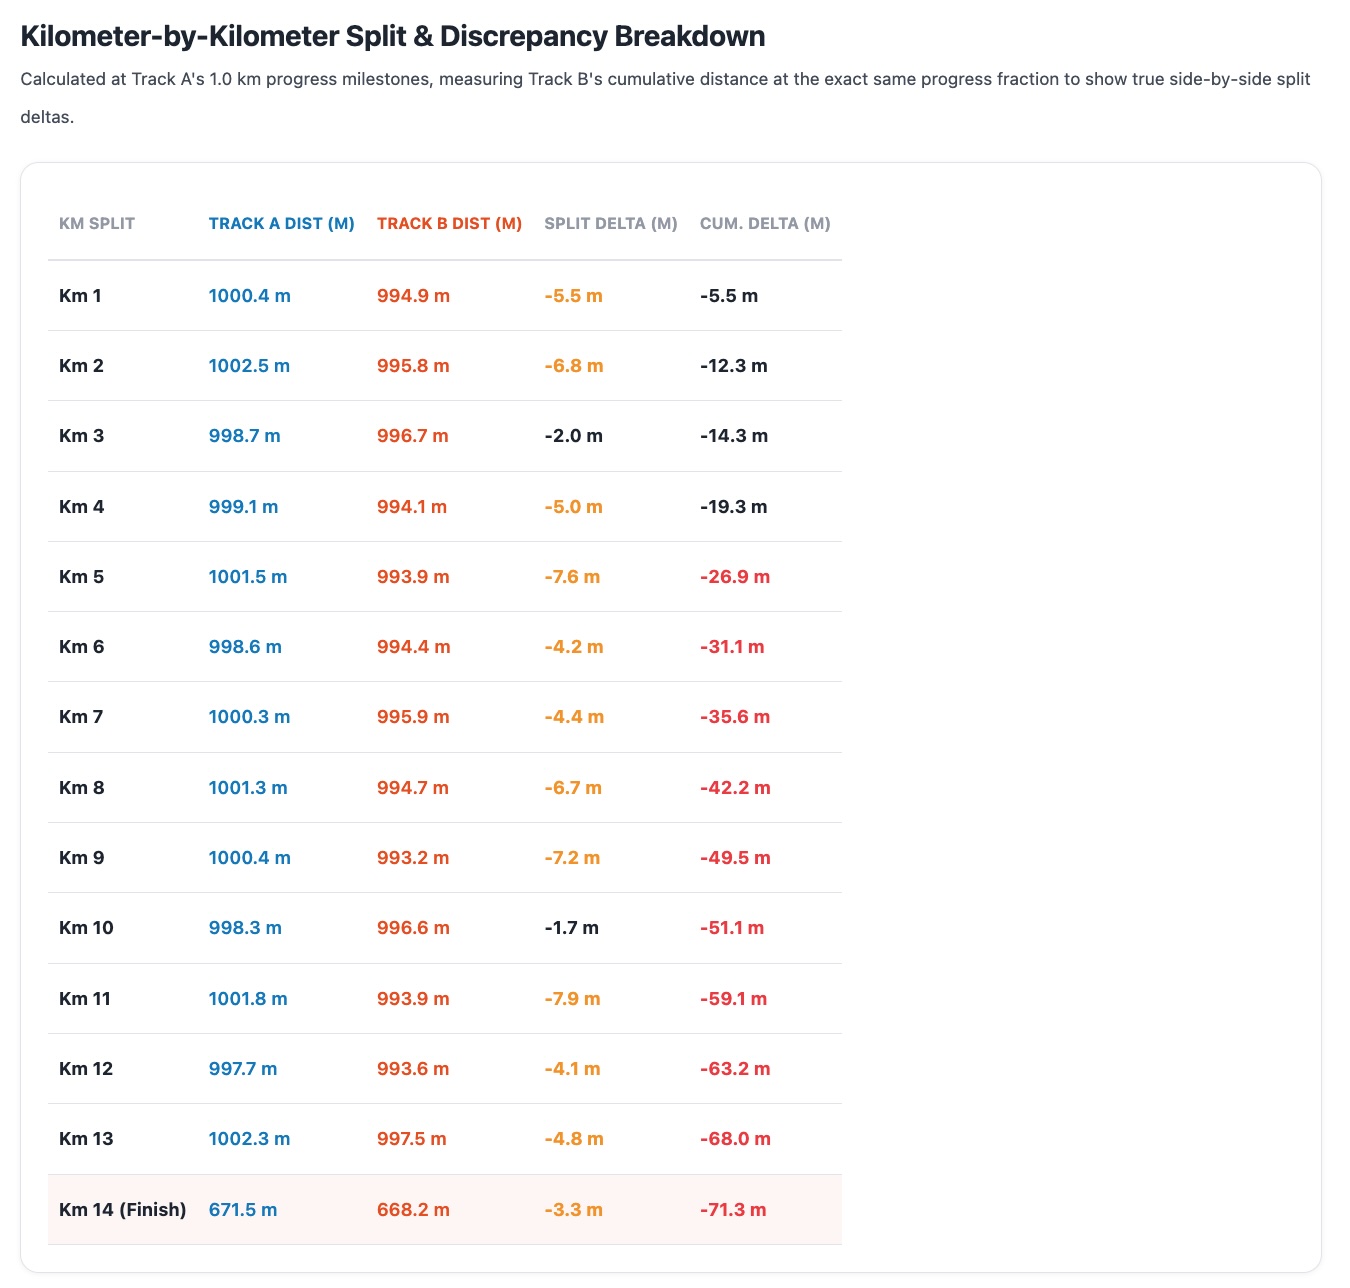
- Consistent Linear Drift (-4.0m to -7.9m / km): In almost every single kilometer, July 29th recorded slightly shorter raw GPS distance than July 20th (averaging -5.1 meters per km).
- Steady Accumulation: This drift accumulated steadily across the entire route: -26.9m at Km 5, -51.1m at Km 10, reaching -71.3m at the Km 14 finish line.
- The Verdict: The 71-meter GPS coordinate gap was NOT caused by a signal dropout or missed turn. It was caused by subtle, continuous satellite line variations under tree cover, building reflections, and cornering line choices accumulated evenly over 14 kilometers.
2. Under the Hood: Why Smartwatches Use “Sensor Fusion”#
To understand why a watch’s distance differs from raw GPS coordinates, we have to look at how modern sports watches (Garmin, Apple Watch, COROS, Suunto) actually compute mileage.
Most runners assume a watch simply sums up latitude and longitude coordinates. In reality, raw satellite tracking is inherently noisy—relying on pure GPS fixes would cause your displayed pace to jump erratically every time you pass under trees or near tall buildings.
To deliver smooth pace and mileage, watch firmware runs a Sensor Fusion engine that combines three primary inputs:
- Wrist Accelerometer (Stride Calibration): Tracks arm swing dynamics and step count. When satellite signals fluctuate, the watch relies on dead reckoning—multiplying estimated stride length by step count.
- Barometric Altimeter (3D Slope Incline): Incorporates atmospheric pressure to calculate 3D gradient hypotenuse distance rather than flat 2D spherical distance.
- Kalman Filtering & Pause Smoothing: Filters out stationary satellite micro-drift while waiting at red lights or crosswalks.
Because wrist arm swing, weather pressure, and stationary pause drift vary from run to run, the watch’s internal sensor fusion engine added +307 meters of extra distance on July 20th, but only +258 meters on July 29th.
3. Deconstructing the 120-Meter Day-to-Day Delta#
The 120-meter gap displayed on the watch screen (Delta Watch) decomposes neatly into two distinct components:
Total Watch Delta (120m) = Raw GPS Line Delta (71m) + Sensor Fusion Delta (49m)
Here is what each component represents:
Raw GPS Coordinates Delta (71 meters): Calculated purely from 2D satellite coordinates (13.67 km - 13.60 km = 71 m). As shown by the per-kilometer breakdown, this 71m gap accumulated gradually (-5.1 m/km) across the entire 14km loop due to subtle variations in tree cover, sidewalk paths, and cornering line choices between the two days.
Sensor Fusion Delta (49 meters): On July 20th, the watch firmware added +307 meters of sensor fusion distance on top of raw GPS coordinates (13.98 km vs 13.67 km). On July 29th, it added +258 meters (13.86 km vs 13.60 km). The difference between these two algorithm additions (307 m - 258 m = 49 m) explains why the final watch mileage gap (120m) was wider than the raw satellite coordinate gap (71m).
4. What This Means for Runners and Developers#
For Runners: A 0.8% Margin of Variance#
A 120-meter difference over 14 kilometers represents a 0.86% margin of variance—well within industry tolerance.
The 71-meter GPS coordinate agreement confirms that your actual physical paths on both days were virtually identical. The slight delta in final mileage displayed on screen is simply the artifact of watch firmware motion filtering.
For Sports Data Engineers & Analytics Platforms#
If you are building running analytics software, GPS tools, or Strava integrations:
- Never assume
raw_points_distance === session_distance: Always parse and preserve bothdata.sessions[0].total_distance(for runner fidelity) and raw point arrays (for map plotting and spatial analysis). - Handle Pause Timer Discrepancies: Raw trackpoint timestamps continue across non-moving intervals, while session duration records net active timer time.
5. Explore It Yourself with Free Web Tools#
We built an interactive, local-first web tool to let runners analyze their own FIT files side-by-side:
👉 Try the GPX & FIT Track Comparator
What You Can Do with the Tool:#
- Dual Track Overlay Map: Render two FIT/GPX files on Leaflet with synchronized scrubber markers so that you can inspect exact spatial gaps at any progress percentage.
- Side-by-Side Metric Table: Compare device recorded distance, raw GPS Haversine distance, sampling rates, moving time, elevation gain, and max spatial gap.
- Automated GPS Drift Diagnostics: Automatically identifies whether distance discrepancies stem from Watch Firmware Fusion, Sampling Frequency Corner-Cutting, or Stationary Pause Drift.
All processing runs 100% locally in your browser with zero cloud uploads, preserving total location privacy while giving you complete clarity over your running data.
Frequently Asked Questions#
Why does the same running route measure differently on different days?#
Satellite position drift, atmospheric conditions, tree canopy changes, and watch sensor fusion algorithms (wrist motion and altimeter data) cause small day-to-day distance variances (typically < 1%).
Why is my watch summary distance longer than the raw GPS points sum?#
Smartwatches use internal sensor fusion algorithms to dead-reckon stride motion and elevation 3D slopes, adding calibrated distance on top of flat 2D GPS points.
What is the GPX & FIT Track Comparator tool?#
It is a free browser-based tool on Apex Run that allows you to upload two running track files, view synchronized route playbacks, and diagnose GPS drift and distance deltas.