
Read the climb on any run
Forty-seven metres of climb on a run whose highest point is thirteen metres above its lowest — both true, and the difference is the whole story of the course. The elevation section is where you see it.
Distance and time are what you did. Elevation is what the ground did to you while you were doing it, and it’s the reason two runs with the same pace can be two very different efforts. Every outdoor run carries it in two places: the pair of cards at the top, and the chart at the bottom.
The two cards#
Up in the metric grid, Elev ↑ is the total climb and Elev ↓ the total descent, both in metres. Two things about them are worth knowing:
- Elev ↑ is the same number your Fitness app shows. It’s the climb your watch recorded for the workout, taken as is. The descent is worked out from the route, which is why on a loop the two come out close but not identical.
- A big gap between them means a point-to-point run, and which way it went. More up than down, you finished higher than you started.
A treadmill run shows neither card, because there was no ground to climb.
The chart#
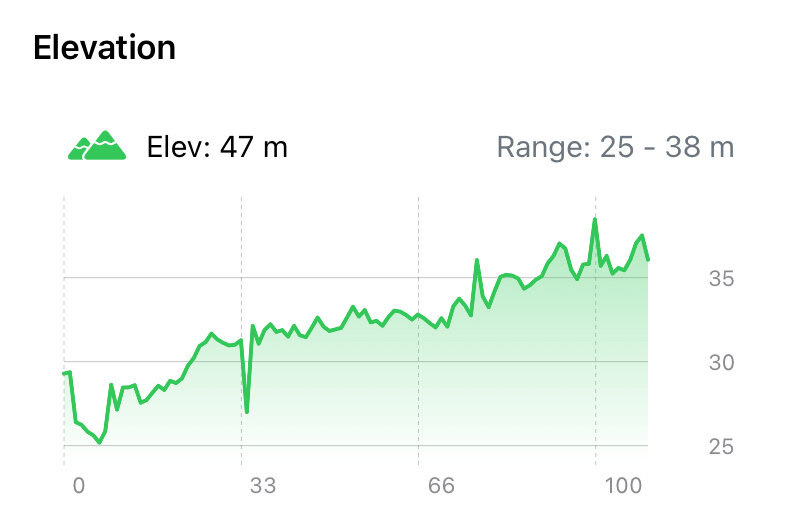
At the bottom of the run, past the heart rate and pace charts, the Elevation section draws the profile. The header carries two numbers:
- Elev — the same total climb as the card above.
- Range — the lowest and highest points of the run. Not how much you climbed; how far apart the top and the bottom of the course were.
The chart is the ground under your feet, start to finish, with time along the bottom. Tap or drag on it to read the altitude at any moment.
Why the climb is bigger than the hill#
The range on the run above is thirteen metres. The climb is forty-seven. Neither is wrong.
Climb counts every metre you went up, and a course goes up more than once. A road that undulates over a bridge, a flyover and a gentle rise adds each one to the total, even though you never got more than a few metres above where you started. The range only knows the extremes. So:
- Small range, big climb — rolling ground. Lots of little ups. Tiring in a way the profile doesn’t look.
- Big range, similar climb — one real hill. The profile shows it plainly.
- Big range, small climb — a point-to-point run downhill, or one long ascent that you started at the bottom of.
For judging how hard a course was, the climb is the number. For recognising a course, the shape is.
The same shape, everywhere else#
The grey silhouette behind the heart rate, pace and grade-adjusted pace charts on the same run is this profile. It’s there so you never have to scroll between charts to ask whether a rise in heart rate was a hill: the hill is drawn behind the heart rate. The full-screen map can paint the route by elevation as well, green at the low end and red at the high, which is the same information laid over the ground itself.
Worth knowing#
- All of it is free, on every outdoor run, however old.
- Elevation is always in metres, even with distances set to miles.
- A spike in the profile that wasn’t a hill is a watch reading, not a climb. Altitude comes from the watch’s own sensor along the route, and a tunnel, a tall building or a pressure change can nudge it. The climb total is more robust than any one point on the line, and the grade-adjusted pace trace inherits whatever the profile shows.
- A run with no map has no profile, because the profile comes with the route. If the run should have one, Reimport fetches it again.
Get the app
Know what the ground did to your run.
Climb, descent and the full profile, on every outdoor run you've ever recorded. All of it free.
↓ Download Apex Run