
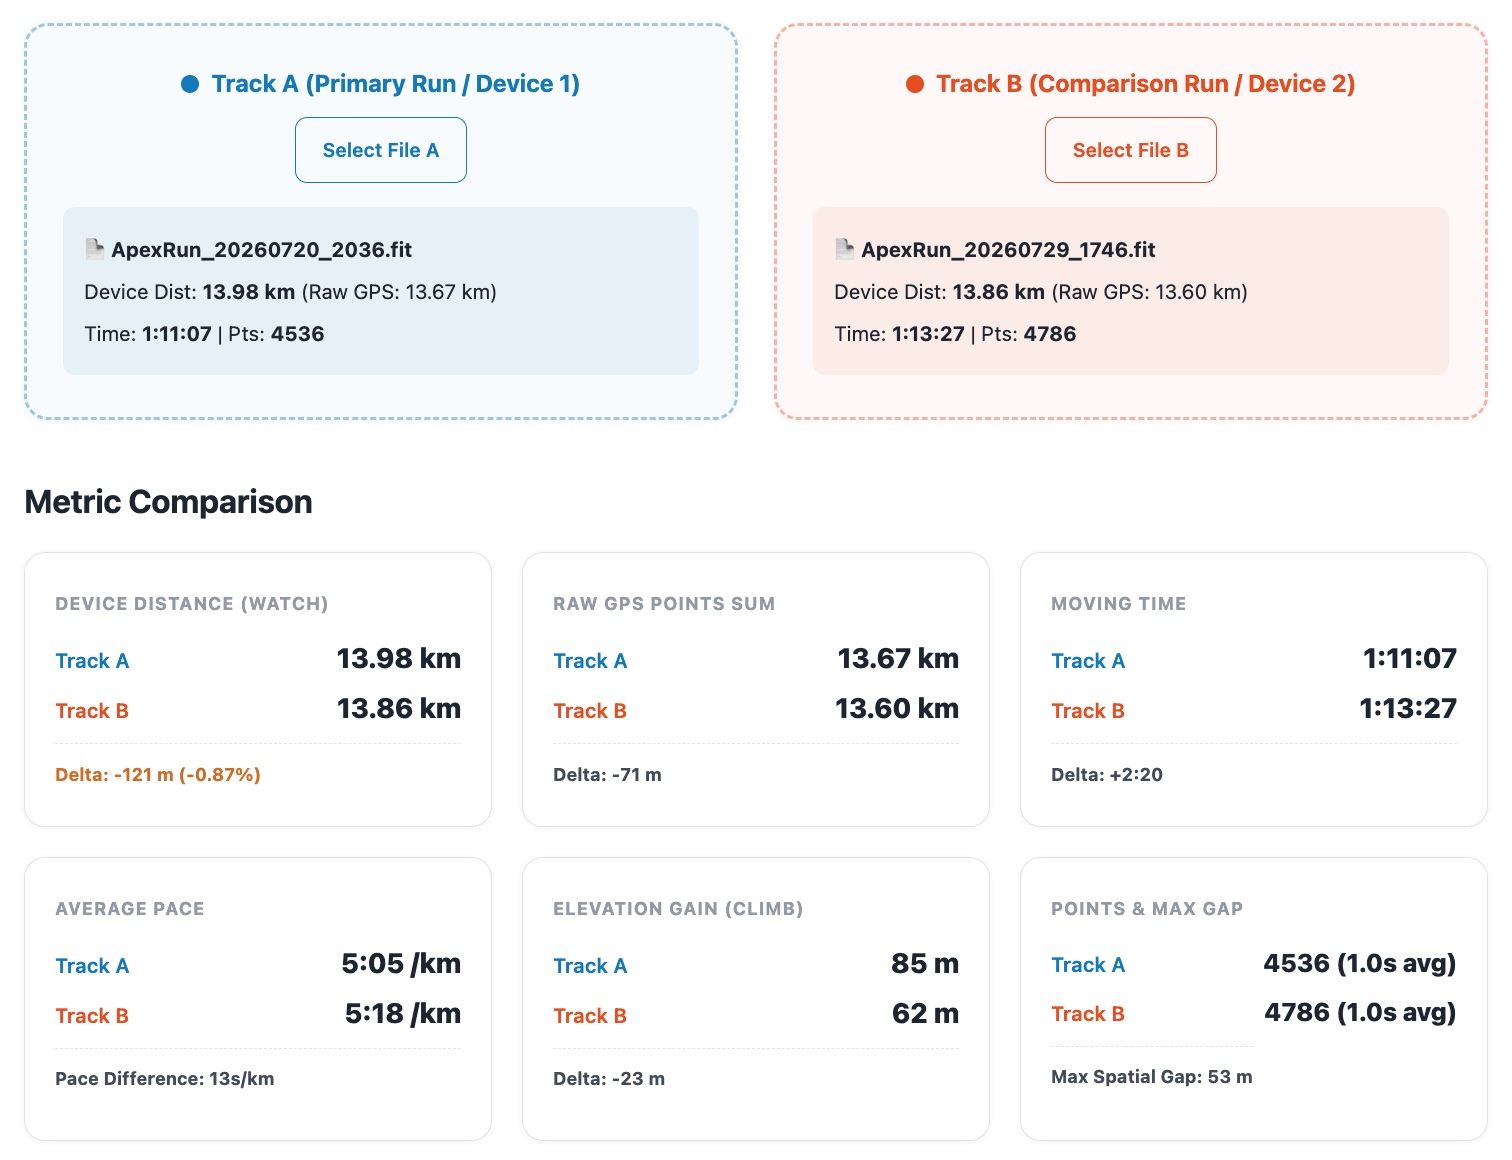
Early this morning, a runner friend reached out with a puzzle that had been bugging him: he ran the exact same 14km loop on two separate days, following the exact same sidewalks. Yet on one day (July 20th) his watch logged 13.98 km, while nine days later (July 29th) it logged 13.86 km — a 120-meter difference on identical ground.
He sent over both raw .FIT files (exported from Apex Run) so I could inspect what was happening under the hood.
From quick file conversion to a new tool#
My first reaction was to drop both files into my existing Running File Converter.
While the converter read the total session mileage recorded by the watch (13.98 km vs. 13.86 km), inspecting a single file at a time didn’t make it easy to pinpoint where or why the numbers diverged between the two days.
I needed a way to lay both tracks directly on top of each other, scrub through every kilometer in sync, and compare raw satellite points against the watch’s recorded summary.
So I built one: the GPX & FIT Track Comparator.
What the raw data revealed#
When I ran both .FIT files through the new dual-track analyzer, the result was genuinely surprising:
- Raw GPS Satellite Points Sum (2D Haversine): 13.67 km (July 20) vs. 13.60 km (July 29) (a 71-meter gap in satellite coordinates).
- Watch Session Header Recorded Distance: 13.98 km (July 20) vs. 13.86 km (July 29) (a 122-meter gap in final watch mileage).
The raw satellite coordinates proved that his physical path on the map across both days was almost 100% identical.
Kilometer-by-Kilometer Split Breakdown#
To pinpoint rendering details of how the two runs diverged, I inspected the Kilometer Breakdown Table, evaluating Track B (July 29) against Track A (July 20) at every 1.0 km milestone:
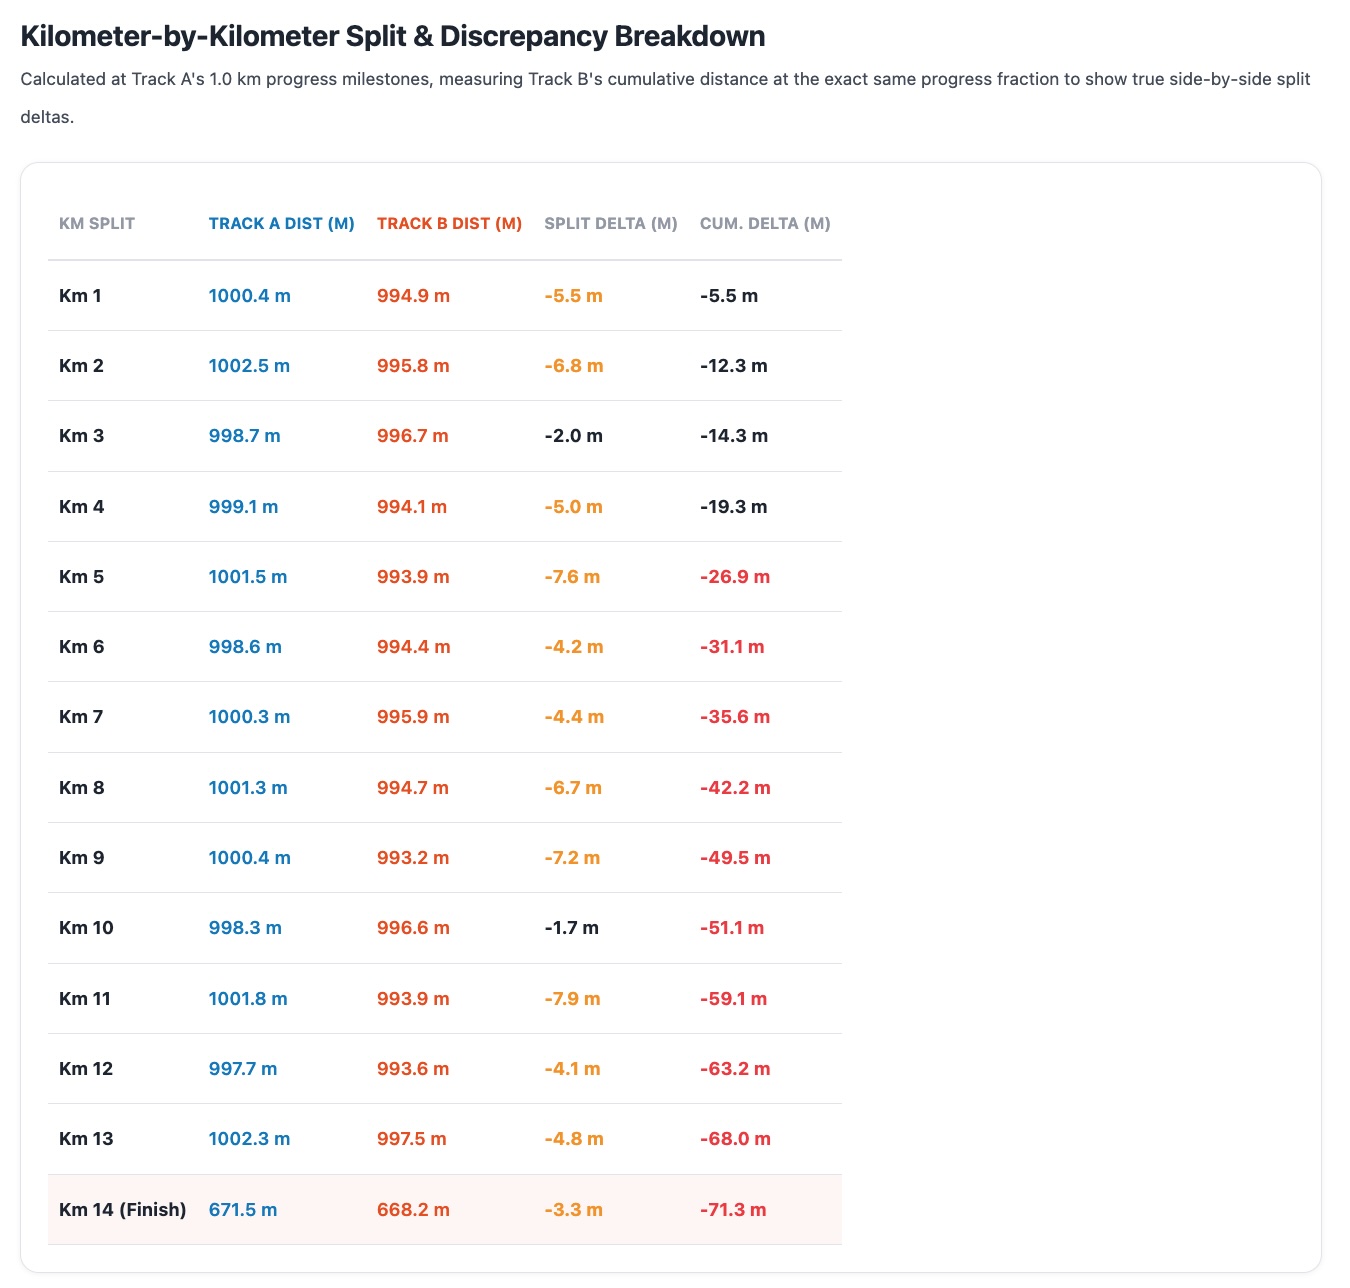
The per-kilometer table revealed a remarkably steady pattern:
- Consistent Linear Drift (-4.0m to -7.9m / km): In almost every single kilometer, Track B (July 29) recorded slightly shorter GPS distance than Track A (July 20) (averaging -5.1 meters per km).
- Steady Accumulation: This drift accumulated steadily across the route: -26.9m at Km 5, -51.1m at Km 10, reaching -71.3m at the Km 14 finish line. This proved the 71m GPS coordinate gap was caused by subtle, continuous satellite line variations under tree cover and cornering line choices throughout the entire 14km run—not a sudden GPS drop or missing finish line segment.
- Firmware Sensor Fusion Addition (-49.7m): The remaining ~50 meters of the 122-meter total watch gap (
122m watch total - 71.3m GPS delta) was added internally by the watch’s accelerometer stride fusion and barometric altimeter slope scaling (+307m on July 20 vs +258m on July 29).
The 3 Drivers of Smartwatch Distance Discrepancies#
The 120-meter discrepancy didn’t come from bad GPS signals — it came from the watch firmware’s internal sensor fusion engine:
- Accelerometer Stride Fusion: Slight variations in running cadence or wrist swing dynamic between the two days led the internal pedometer fusion to estimate slightly different step lengths.
- Barometric Altimeter 3D Slope: Slight atmospheric pressure changes between July 20th and July 29th altered the 3D elevation slope distance calculation.
- Kalman Filter & Red Light Pauses: Micro-drift differences while waiting at traffic intersections accumulated slightly different stationary distances.
Built for the web, 100% local#
What started as a morning debugging chat turned into a brand-new tool on my website.
The GPX & FIT Track Comparator (and my standalone GPS Drift & Accuracy Analyzer) run entirely inside your browser. No files are uploaded to any cloud server, preserving total location privacy while giving runners a clean, interactive way to solve their own GPS mysteries.
Next time you run your benchmark loop and wonder why today’s distance doesn’t match last week’s, you’ll know where to look.