
There’s a question every runner asks on the morning of a hard session: am I ready for this?
Most of the time, the answer is somewhere in three places — how your HRV looks, how your sleeping heart rate compared to normal, and how well you actually slept. They’re all in Apple Health. They just aren’t talking to each other.
Recovery pulls them together.
No composite score#
The first design decision was the most deliberate: no single number.
Composite scores — the kind that collapse three or four metrics into a score out of 100 — require arbitrary weighting. How much is HRV worth versus sleep? The answer differs by person, by training phase, and honestly, nobody knows. What you get instead is a black box that loses your trust the moment it tells you you’re 84% recovered and you feel terrible.
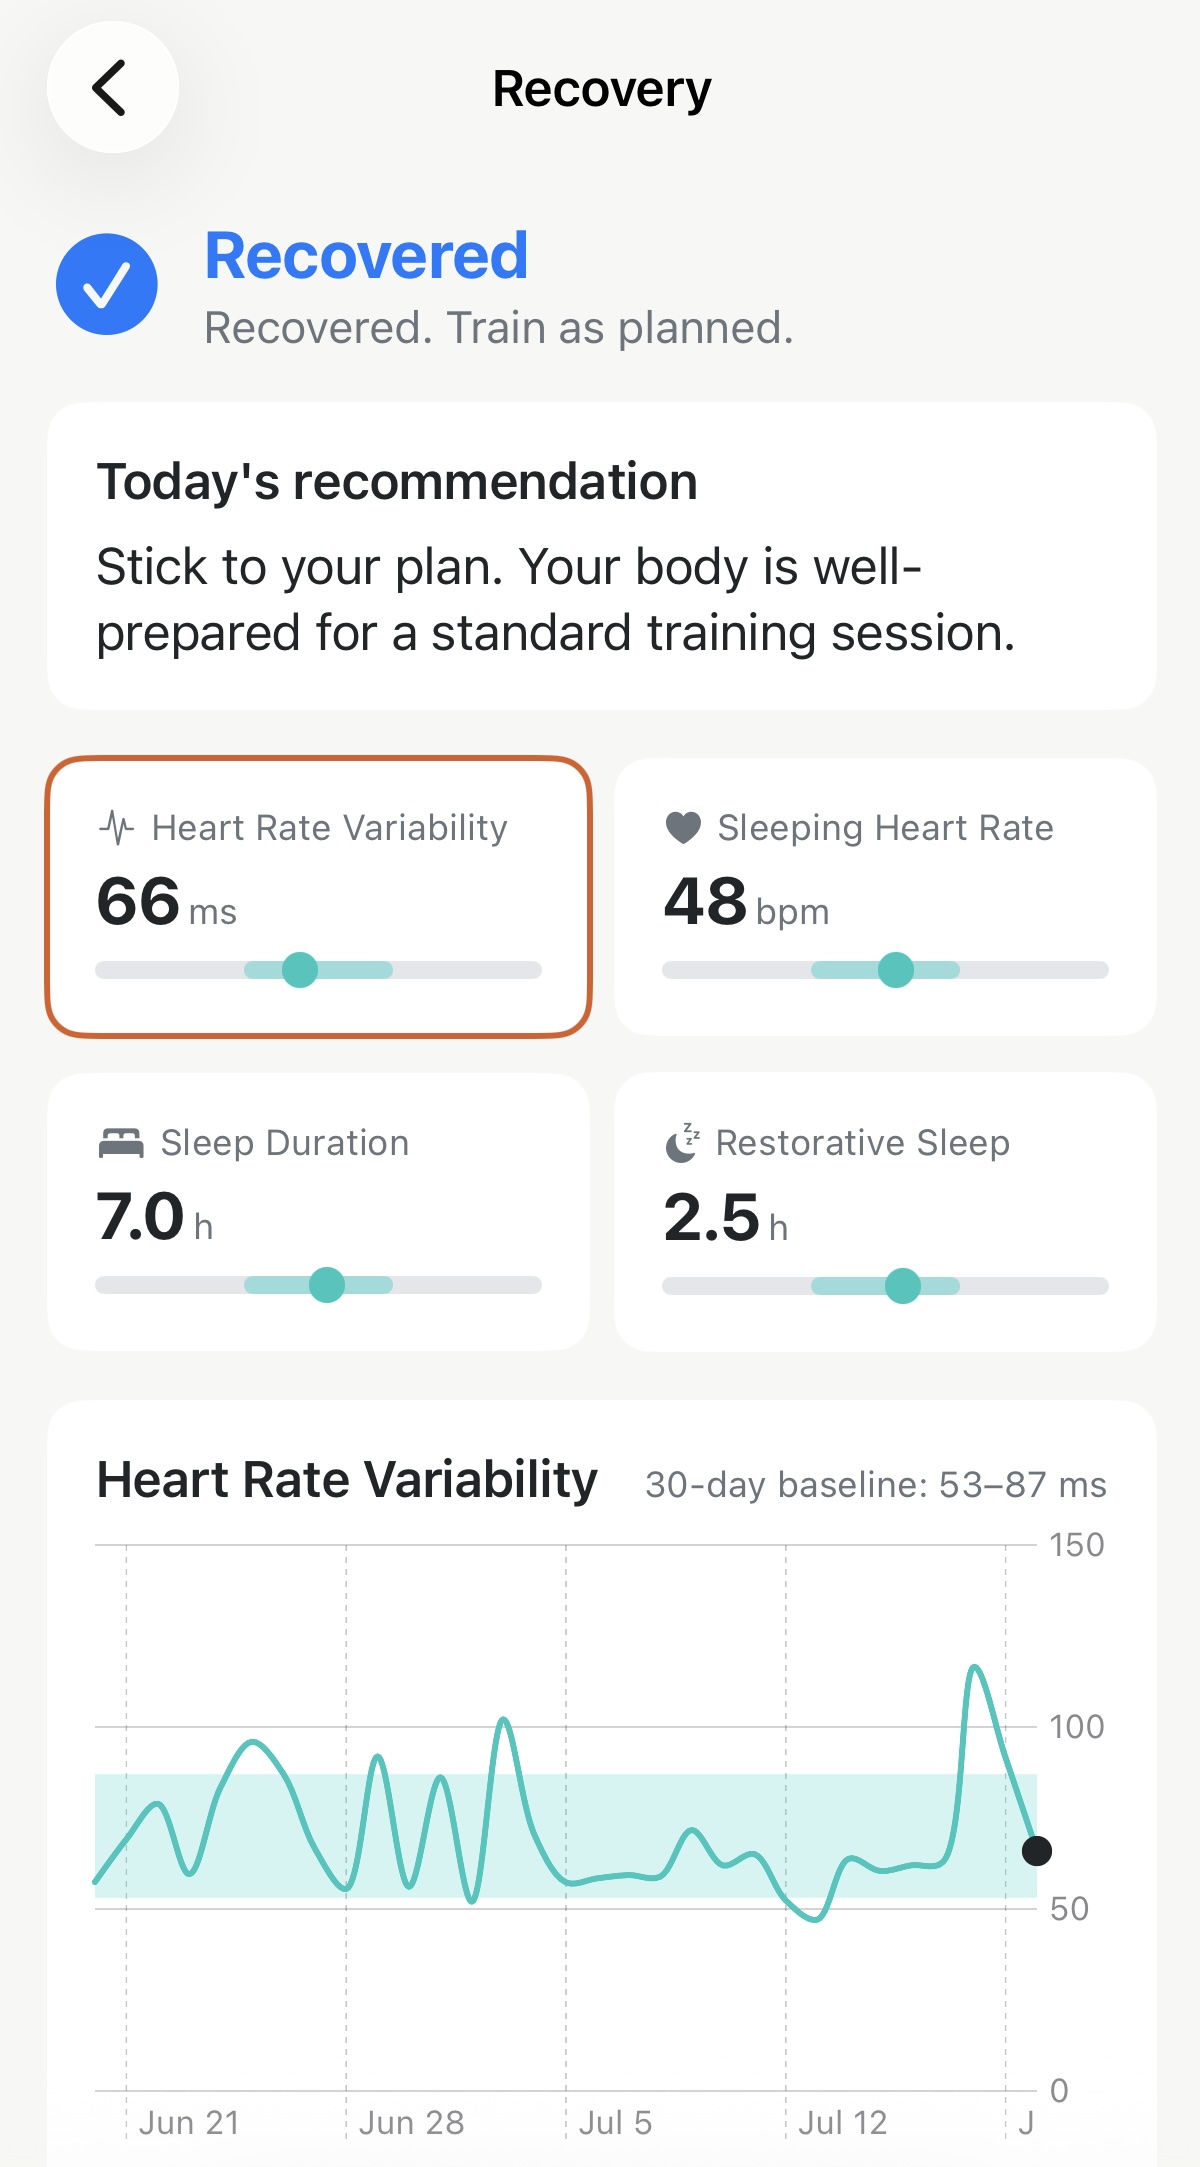
So Recovery doesn’t do that. Instead, it shows you the underlying values, each measured against your personal baseline, and gives you a clear state: Optimal, Recovered, Compromised, or Fatigued. Plus one concrete sentence about what to do with that.
Every number is auditable. Nothing is hidden behind an algorithm you can’t inspect.
The signals that actually matter#
Not all “recovery” metrics are equal. HRV is the primary driver. It’s the most sensitive acute signal of nervous system state — when you’re fatigued, it drops; when you’ve absorbed training well, it rises. Sleeping heart rate is the secondary signal: elevated overnight HR suggests your body is working harder than usual to maintain homeostasis.
What’s not a recovery driver: daytime resting heart rate. It drifts constantly with activity, caffeine, posture, and temperature. It’s a useful long-term cardiopulmonary fitness indicator, but it’s too noisy to tell you anything reliable about today. Using sleeping HR instead gives you the clean acute signal — measured at rest, overnight, when external noise is minimised.
Sleep duration acts as a floor. If you slept less than a threshold, the state can be downgraded regardless of how good your HRV looks. A single night of short sleep doesn’t override everything — but it applies appropriate pressure downward.
How the baseline works#
The band you see on the HRV chart isn’t a fixed range, and it isn’t your historical min/max. It’s mean ± one standard deviation, calculated across your prior ~30 days (minimum 7 data points, prior days only — today never contaminates its own baseline).
This makes it robust against outliers. An unusually high or low day doesn’t collapse the band or stretch it permanently. And it’s personalised by construction: the same absolute HRV number might be elevated for one runner and suppressed for another. What matters is deviation from your norm, not comparison to anyone else’s.
Today’s value is classified as suppressed, normal, or elevated relative to that band. The recovery state follows from that classification, weighted by the sleep floor.
The number you never thought to look for#
Before building this, I pulled my own HRV data from Apple Health — months of readings I’d never actually looked at.
The patterns were there. A visible dip during a heavy training block in May. A steady climb during the easy week before a race. The signal existed the whole time, quietly accumulating in the background while I made training decisions based on feel alone.
Recovery is an attempt to make that signal actionable — not a dashboard to study, but a daily answer that’s ready before your shoes are on.
If you want the science behind HRV and why it’s a reliable recovery signal, the HRV and Running Recovery guide goes deeper.